Simple Arduino Sensors Proxy - aka SASP
⚠️ Project Status: Deprecated
This project is no longer maintained. It was originally hosted on Google App Engine (2011–2017) and used Google Visualization Tables for real-time sensor data display. After relocating in 2025, I migrated all sensor integrations to Home Assistant, which provides superior capabilities and easier management.
The code, schematics, and documentation are archived here for historical reference only.
Project Overview
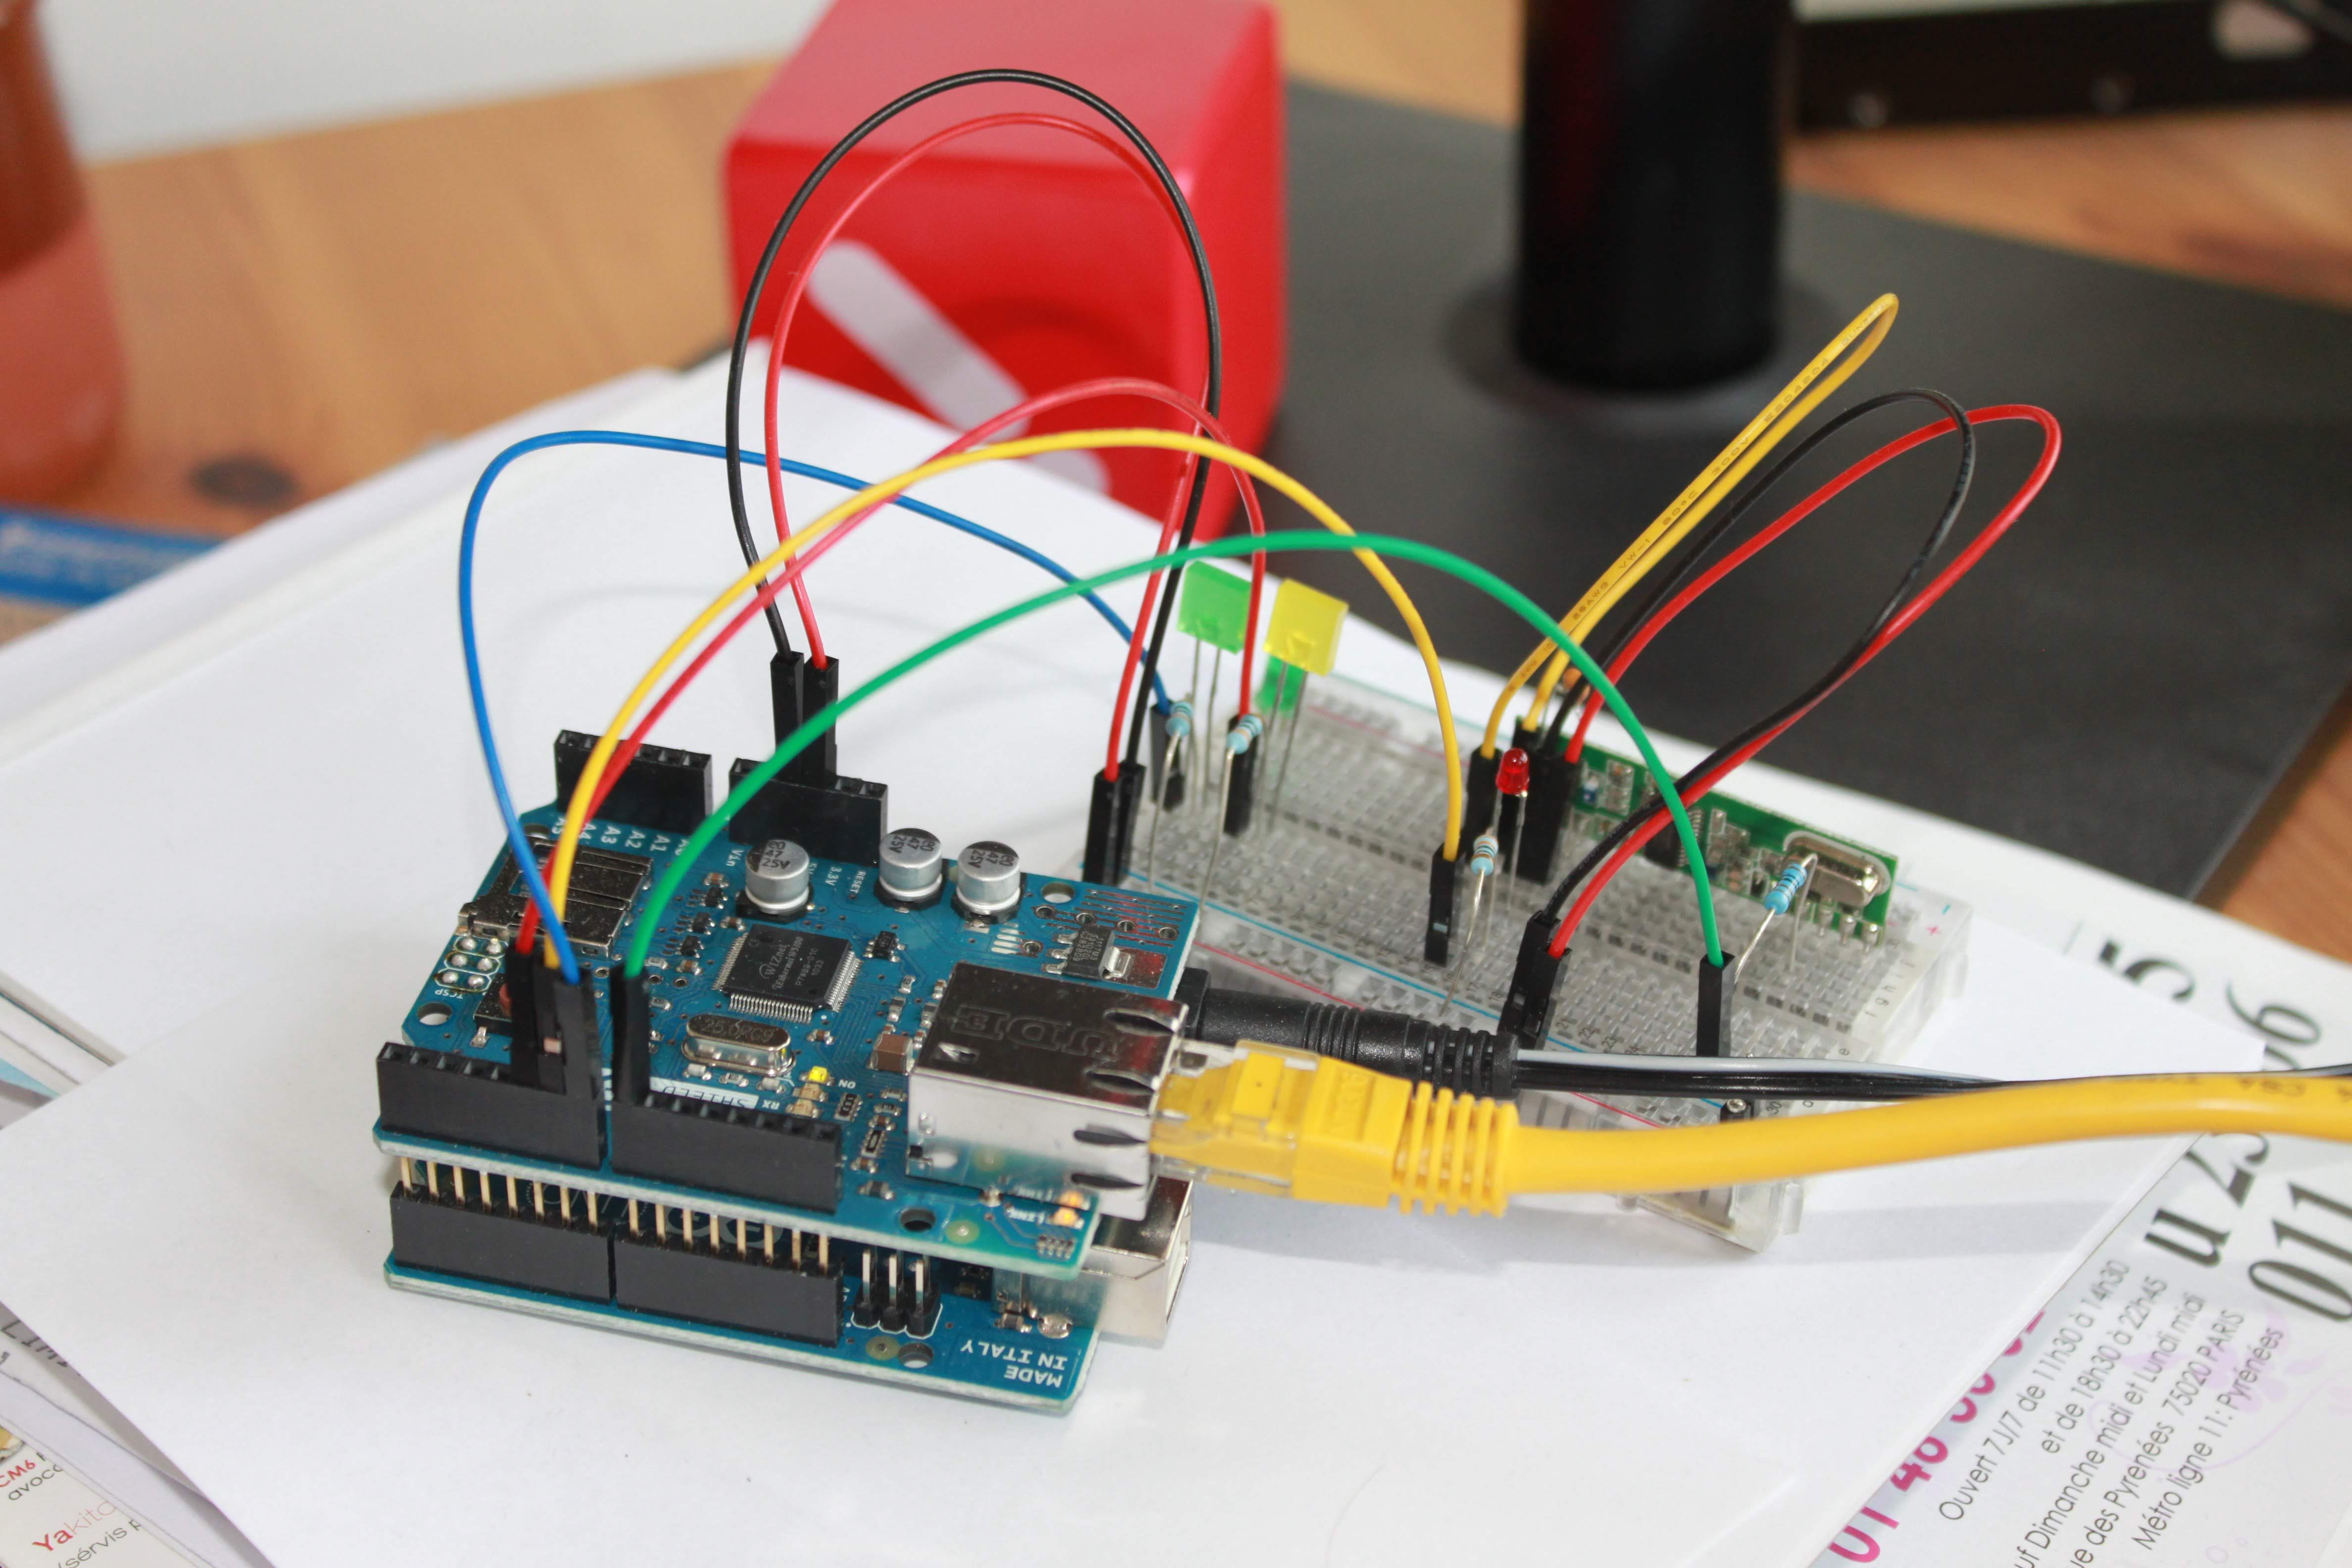
The goal of this project was to decode values transmitted by Oregon Scientific weather sensors and send them over the internet. The Arduino hardware received RF signals, decoded the protocol, and published readings to a web service where they could be visualized in real-time using Google Visualization API.
Hardware Setup
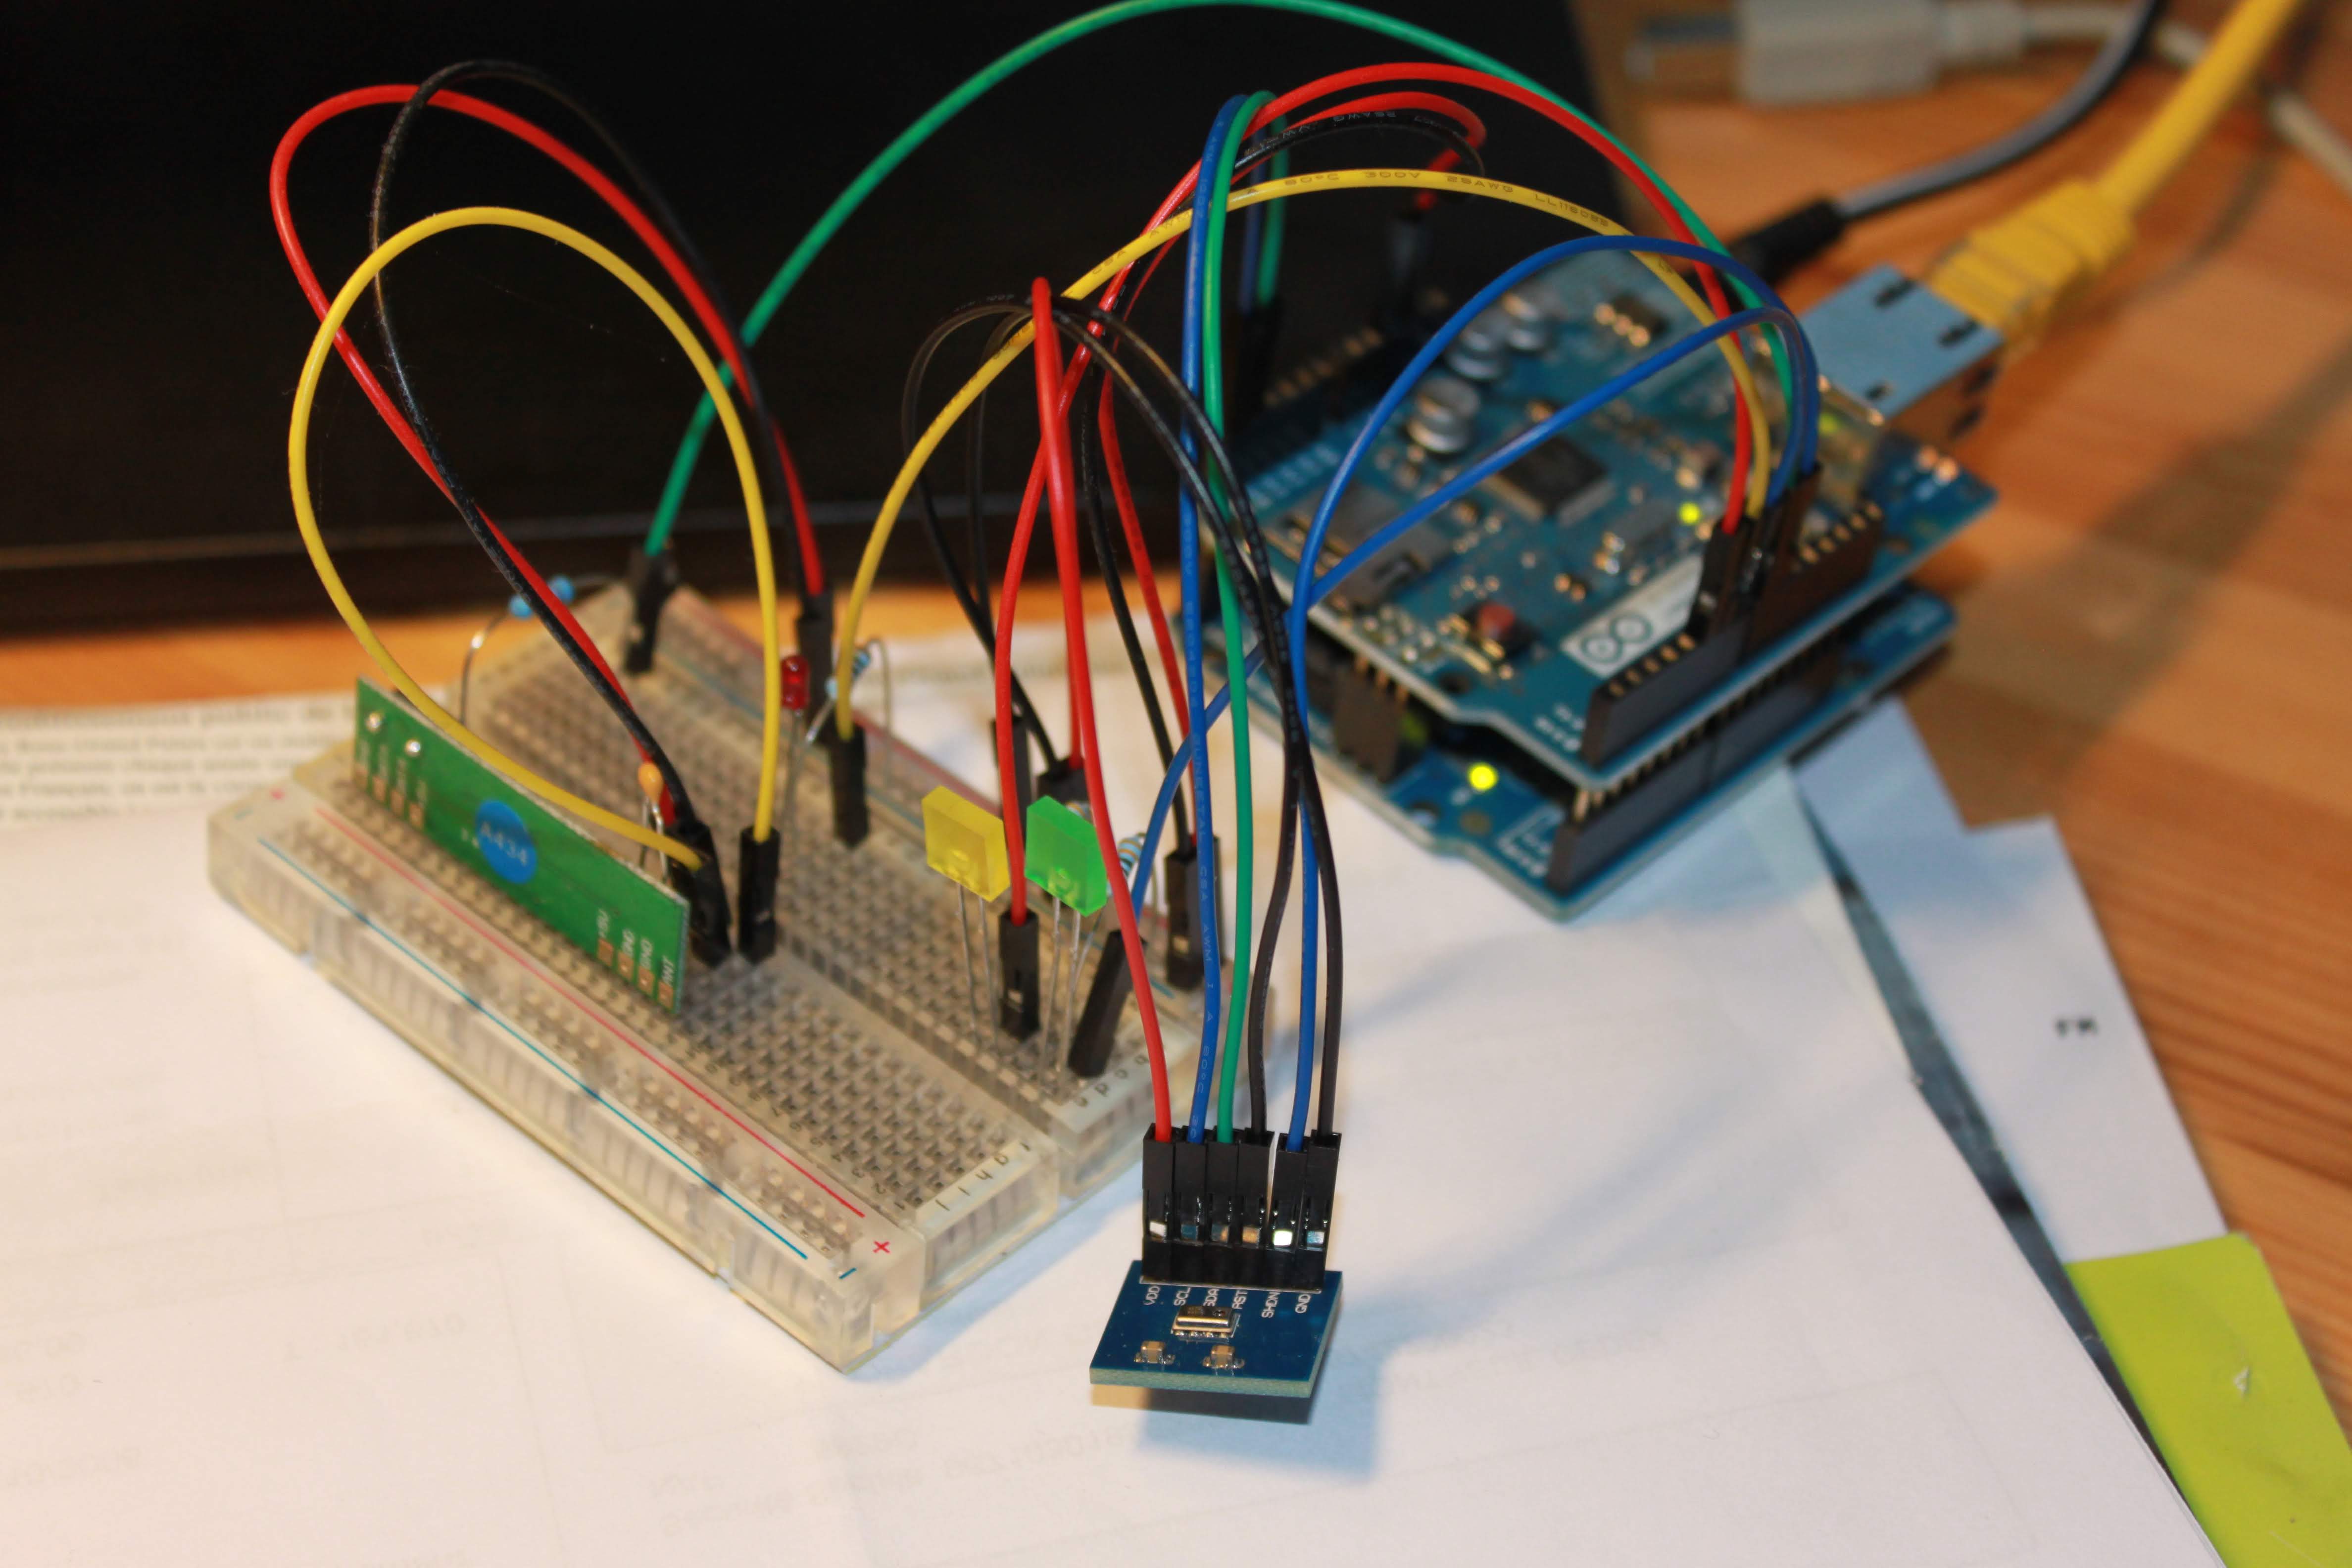
- Arduino Uno — main microcontroller
- Ethernet Shield — network connectivity
- 434 MHz Receiver (RLP 434A) — RF decoding
- MPL115A2 (I2C Barometer) — additional pressure sensor [optional]
Supported Sensor Protocols
- THGR122NX (0x1D20) — temperature/humidity
- THGN801 (0xF824) — temperature/humidity
- THGR810 (0xF8B4) — temperature/humidity
- THWR800 (0xC844) — temperature/humidity
- UVR128 (0xEC70) — UV sensor
- MPL115A2 (I2C custom SA1 protocol) — barometric pressure
Legacy Screenshots
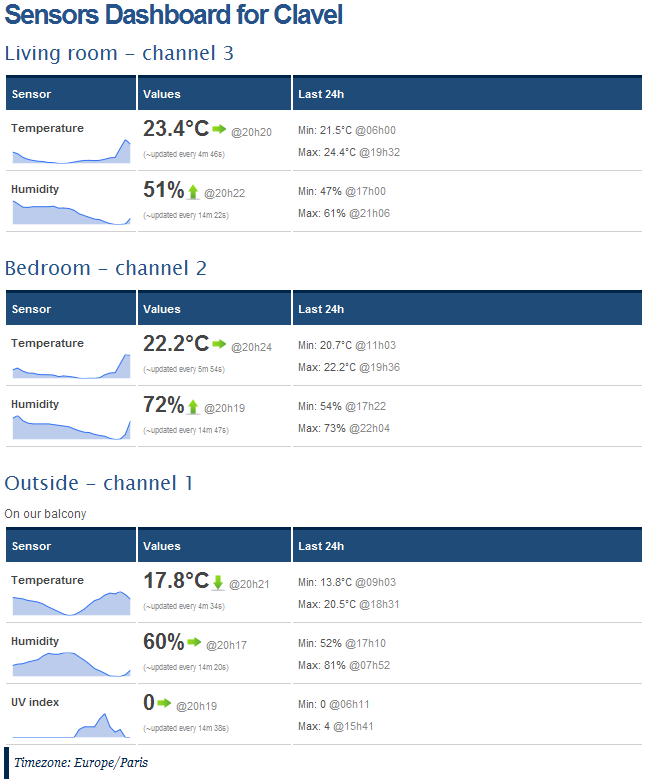
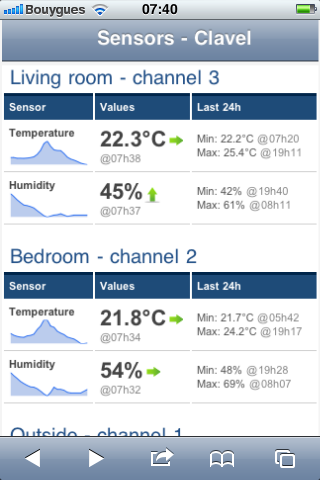
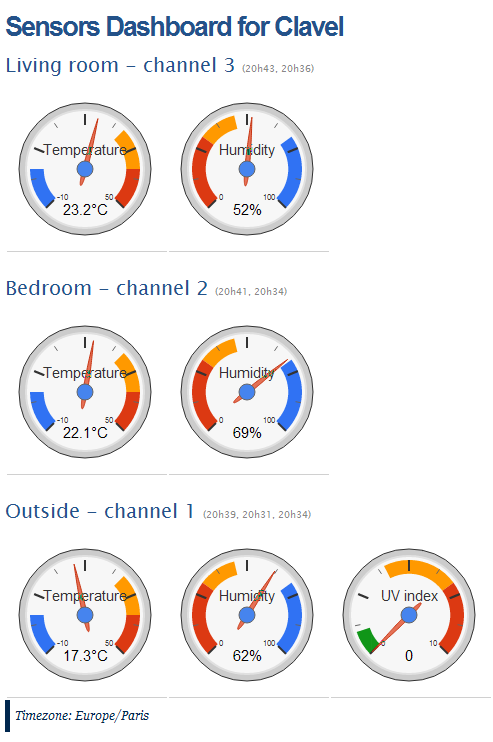
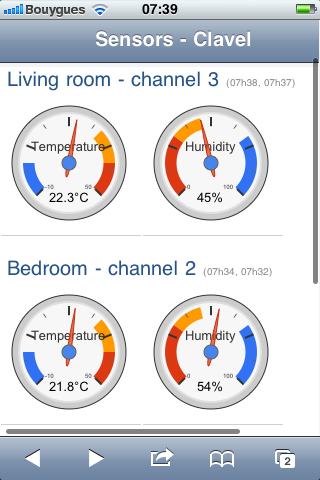
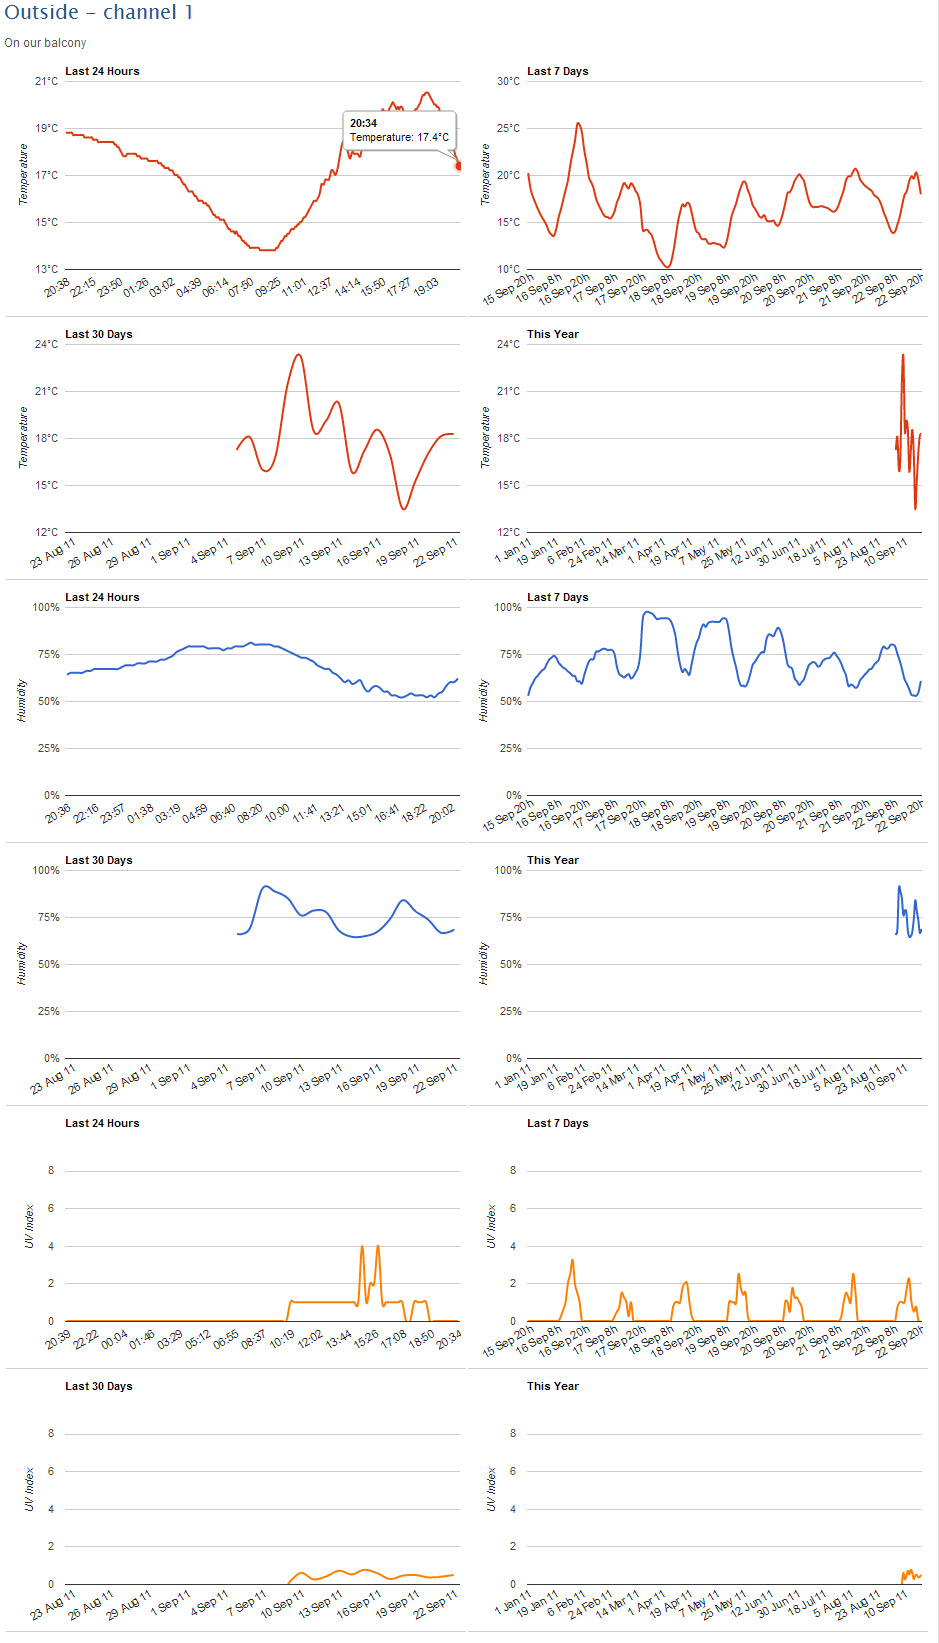
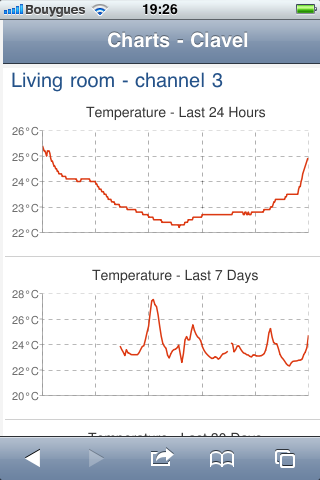
Below are screenshots from the Google App Engine era, showing the real-time sensor dashboard and visualization interface:
References & Resources
- Weather Station Data Logger project
- Decoding the Oregon Scientific V3 433.92MHz Sensors
- Home Assistant — Modern replacement platform